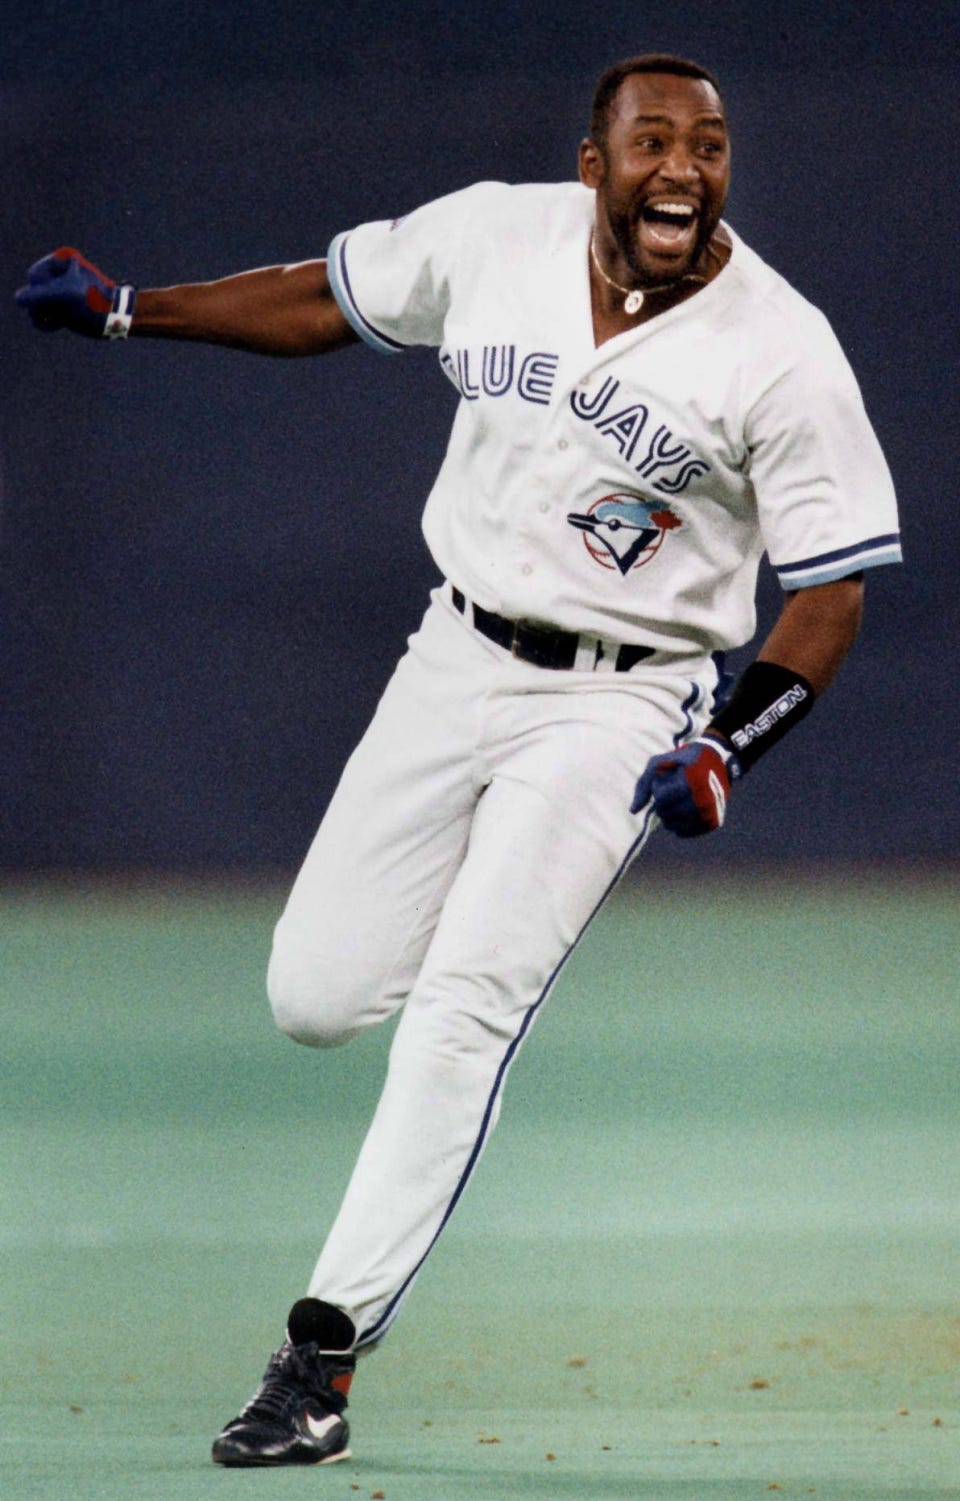
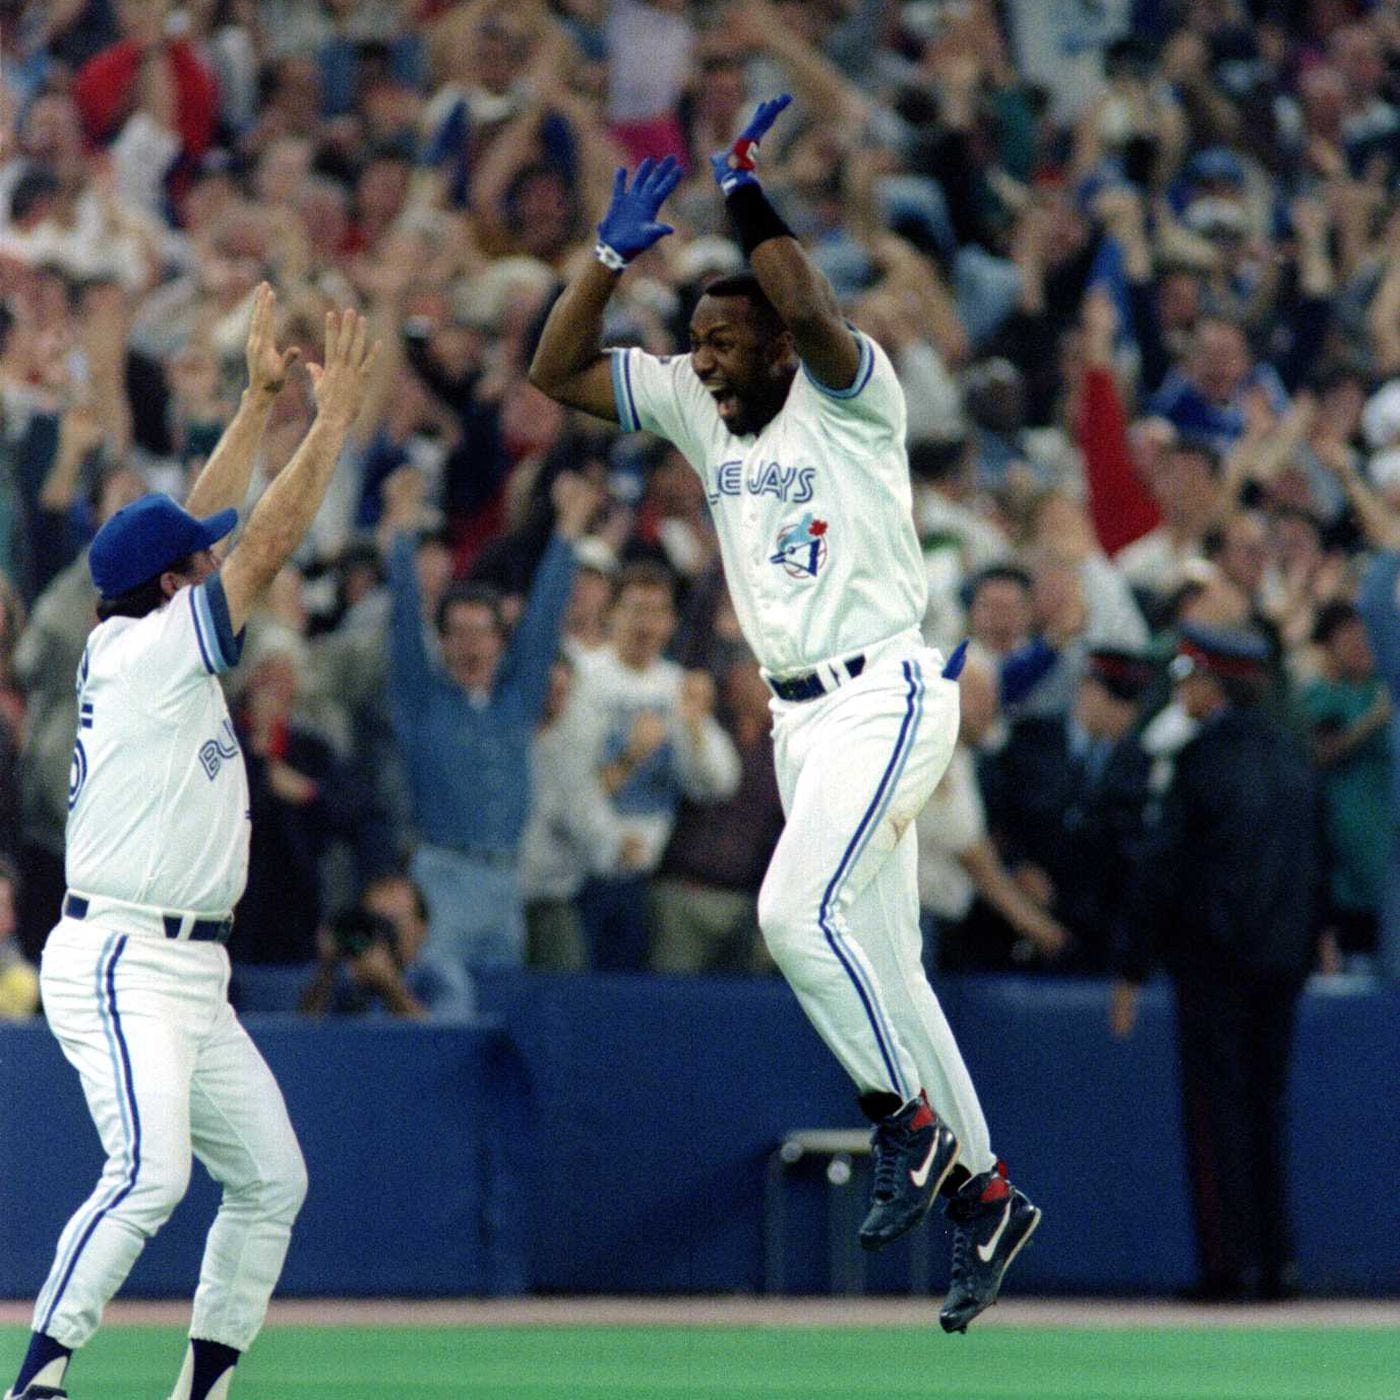
Joe Carter: More Than Just a World Series Hero?
The Power Hitter Pantheon: Baseball’s Greatest Home Run Heroes

This project aims to determine the greatest home run hitter of all time by comparing each slugger’s statistics to the average of their era using three formulas. The final adjusted stats will then be used to compare them head-to-head with other all-time greats.
Joe Carter will be the next legendary MLB slugger examined in this study. For a detailed biography of Carter, please click here. Before fully analyzing Carter’s AB/HR figures using our formulas and methodology, it’s important to review his key hitting statistics to understand the extent of his offensive impact at the plate.
Total Bases: 3,910
Extra Base Hits: 881
Homeruns: 396
On Base + Slugging: .771
Slugging Percentage: .464
On Base Percentage: .306
Batting Average: .259
Now that we’ve reviewed Carter’s key hitting statistics, it’s important to highlight his career accomplishments to fully appreciate his overall talent as a baseball player:
2x World Series Champ: 1993 & 1993 (Blue Jays)
2x AL Silver Slugger (1991 & 1992)
30-HR Seasons: 6 (1987, 1989, 1991-1993, & 1996)
20-HR Seasons: 12 (1986-1997)
200 Hits Seasons: 1 (1986)
100 Runs Scored Seasons 1 (1986)
Now that his career accomplishments are clear, let's examine Joe Carter's rankings on MLB leaderboards in key hitting statistics:
1986: #7 (.514)
1986: #4 (108)
1986: #7 (200)
1986: #3 (341)
1988: #7 (297)
1989: #6 (303)
1991: #5 (321)
1992: #4 (310)
1991: #5 (42)
1986: #6 (9)
1988: #10 (27)
1989: #4 (35)
1991: #6 (33)
1992: #5 (34)
1986: #4 (74)
1988: #5 (69)
1989: #4 (71)
1991: #2 (78)
1992: #3 (71)
1993: #10 (71)
1986: #7 (116)
Joe Carter’s best season was 1986, when he appeared on 7 MLB hitting leaderboards: #7 in Slugging Percentage (.514), #4 in Runs Scored (108), #7 in Hits (200), #3 in Total Bases (341), #6 in Triples (9), #4 in Extra Base Hits (74), and #7 in Runs Created (116). This exceptional year showcased his all-around offensive prowess, with elite power (341 total bases, 74 extra-base hits) and scoring ability (108 runs), marking the peak of his career.
Now that we have a deeper appreciation for Joe Carter as a hitter, we can move forward with our unique career AB/HR analysis. According to Baseball Reference, Carter’s official statistics reveal a total of 396 home runs over 8,422 at-bats resulting in an average of at-bats per home run 21.27 (AB/HR).
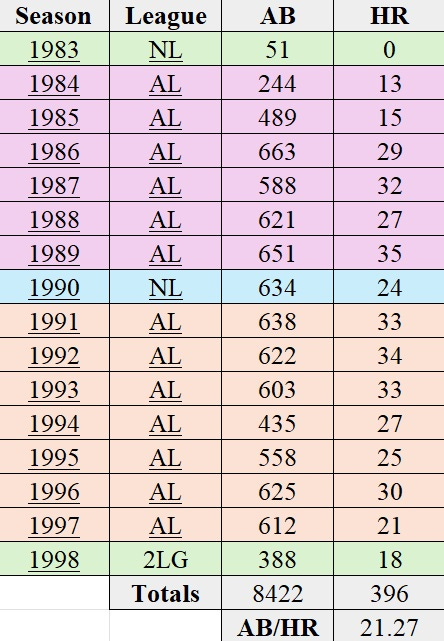
Joe Carter spent most of his career in the American League (AL), playing from 1984 to 1989 and again from 1991 to 1997. He played exclusively in the National League (NL) during the 1983 and 1990 seasons.
Carter played in both the AL and NL in 1998. Since the designated hitter (DH) rule applied exclusively to the AL at the time, hitters are compared within their respective leagues. To calculate the overall 1998 league averages for Carter, we combined and averaged out the figures from both leagues.
When aggregating the statistics from each of the seasons Carter competed in, the league totals include 1,193,915 at-bats and 33,112 home runs, resulting in an average of 36.06 at-bats per home run (AB/HR).
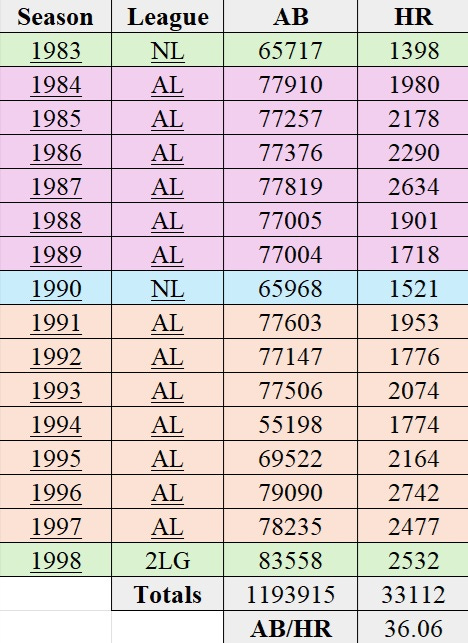
With this data, we can evaluate how Carter’s performance compared to the average AL/NL hitter of his era.
Raw Difference: -14.79
Formula: League Average – Player Career AverageImprovement Factor: 1.70x
Formula: League Average / Player Career AveragePercentage Difference: 41.01%
Formula: (League Average – Player Career Average) / League Average × 100%
AB/HR
Carter hit a home run approximately every 21.27 at-bats, indicating strong power-hitting ability for his era. The combined AL/NL average of 36.06 AB/HR suggests that the typical hitter required significantly more at-bats to hit a home run.
Raw Difference
Carter required 14.79 fewer at-bats per home run than the league average, highlighting his superior power efficiency.
Improvement Factor
Carter’s AB/HR was 1.70 times better than the league average, meaning he hit home runs at a rate 70% more efficient than the typical hitter.
Percentage Difference
Carter’s AB/HR was 41.01% better than the league average, reinforcing his status as an above-average power hitter.
Joe Carter’s career home run efficiency, with an AB/HR of 21.27, was substantially better than the league average of 36.06 AB/HR during his playing years (1983–1998). This translates to a raw difference of 14.79 fewer at-bats per home run, an improvement factor of 1.70x, and a 41.01% better performance than the typical AL/NL hitter.
In our initial case study, we analyzed the careers of prominent Japanese and Negro League sluggers, alongside MLB greats Mickey Mantle, Alex Rodriguez, and Joe DiMaggio for comparison.
Now, let's compare Carter’s career statistics against these baseball legends to gain a clearer perspective on how he stacks up.
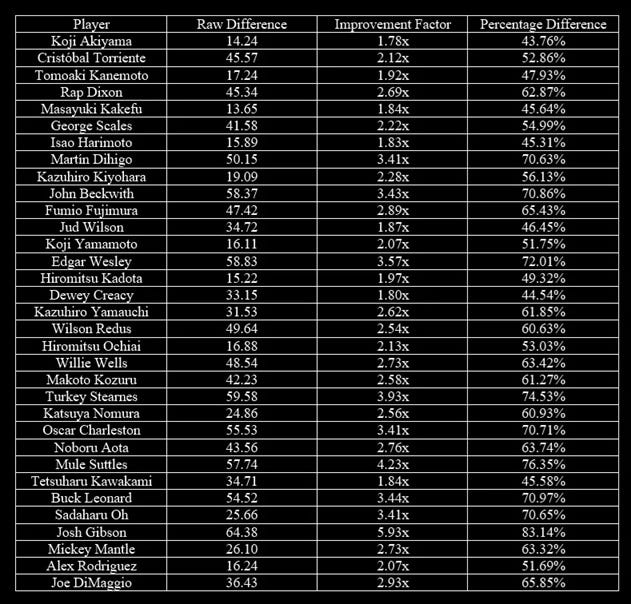
Joe Carter’s statistics closely mirror those of Koji Akiyama, a Japanese League legend. Akiyama (-14.24/1.78x/43.76%) hit a total of 437 home runs over 7,997 at-bats resulting in an average of at-bats per home run 18.30 (AB/HR). The league average during Akiyama’s career was 32.54.
Among the league leaders in home runs during the 1990s, we have analyzed the power-hitting careers of the following players:
Vladimir Guerrero (-14.40/1.79x/44.23%)
Vinny Castilla (-13.04/1.61x/37.95%)
Tino Martinez (-12.08/1.58x/36.54%)
Shawn Green (-10.13/1.47x/31.94%)
Sammy Sosa (-20.59/2.42x/58.73%)
Ryne Sandberg (-13.89/1.47x/31.84%)
Ron Gant (-16.41/1.82x/44.95%)
Rob Deer (-22.42/2.33x/57.06%)
Rafael Palmeiro (-15.95/1.87x/46.43%)
Mo Vaughn (-16.09/1.95x/48.82%)
Mike Piazza (-17.68/2.09x/52.20%)
Mickey Tettleton (-16.65/1.87x/46.47%)
Matt Williams (-17.62/1.95x/48.75%)
Mark McGwire (-23.70/3.23x/69.08%)
Manny Ramirez (-17.29/2.16x/53.80%)
Larry Walker (-17.35/1.96x/49.04%)
Kevin Mitchell (-21.80/2.23x/55.23%)
Ken Griffey Jr. (-17.84/2.15x/53.41%)
Juan Gonzalez (-18.24/2.21x/54.69%)
Jose Canseco (-18.87/2.24x/55.27%)
Joe Carter’s stats (-14.79/1.70x/41.01%) place him 16th in raw difference and 17th in both improvement factor and percentage difference among 21 elite MLB hitters. Carter outperforms Vladimir Guerrero in raw difference but trails in other metrics, positioning him as a solid and respectable performer when pitted against top tier power hitters.
If you find this content valuable and would like to support the ongoing studies and articles, your contributions via CashApp are truly appreciated.
Your support helps fund the tools, research, and time dedicated to these projects. Every contribution, no matter the size, plays an important role in keeping this work going.
If you're unable to contribute financially, sharing this article on your social media (X, Facebook, etc.), emailing it to a friend, or texting the link to a fellow baseball fan is just as valuable.
Thank you for your support!