Mickey Tettleton: Froot Loops
The Power Hitter Pantheon: Baseball’s Greatest Home Run Heroes

This project aims to determine the greatest home run hitter of all time by comparing each slugger’s statistics to the average of their era using three formulas. The final adjusted stats will then be used to compare them head-to-head with other all-time greats.
Mickey Tettleton will be the next legendary MLB slugger examined in this study. For a brief biography of Tettleton, please click here.
Before analyzing Tettleton's career numbers, it's essential to recognize his accomplishments as a hitter. Let's examine his rankings in key hitting statistics throughout his career. Mickey Tettleton appeared on the MLB leaderboards in the following categories:
1991: #9 (31)
1992: #9 (32)
1990: #2 (106)
1991: #5 (101)
1992: #2 (122)
1993: #9 (109)
1994: #2 (97)
1995: #5 (107)
1989: #7 (15.81)
1991: #5 (16.16)
1992: #6 (16.41)
1995: #5 (13.41)
Mickey Tettleton’s best season at the plate was 1992. In that year, he hit 32 home runs (#9), drew an exceptional 122 walks (#2), and had a solid 16.41 AB/HR (#6), appearing on three leaderboards with high marks in both power and plate discipline.
Tettleton’s consistent presence on walk leaderboards (six seasons) highlights his elite plate discipline, while his HR and AB/HR rankings in 1991–1992 and 1995 underscore his power-hitting ability, peaking in 1992.
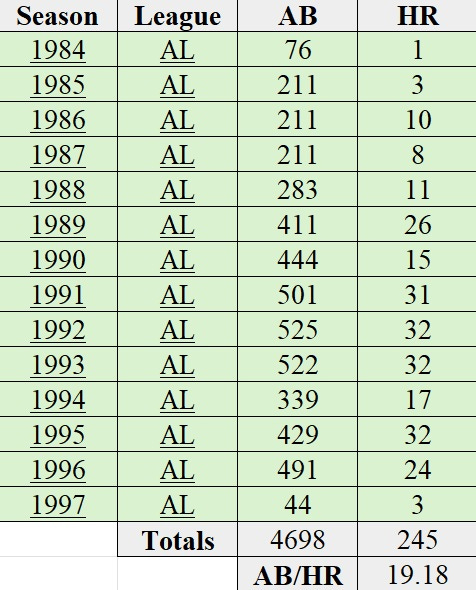
Now that we have a clear understanding of Tettleton's accomplishments, we can proceed with the career analysis. According to Baseball Reference, Tettleton’s official statistics reveal a total of 245 home runs over 4,698 at-bats resulting in an average of at-bats per home run 19.18 (AB/HR).
Mickey Tettleton played in the American League (AL) from 1984 to 1997. When aggregating the statistics from each of the seasons Tettleton competed in, the league totals include 1,055,472 at-bats and 29,457 home runs, resulting in an average of 35.83 at-bats per home run (AB/HR).
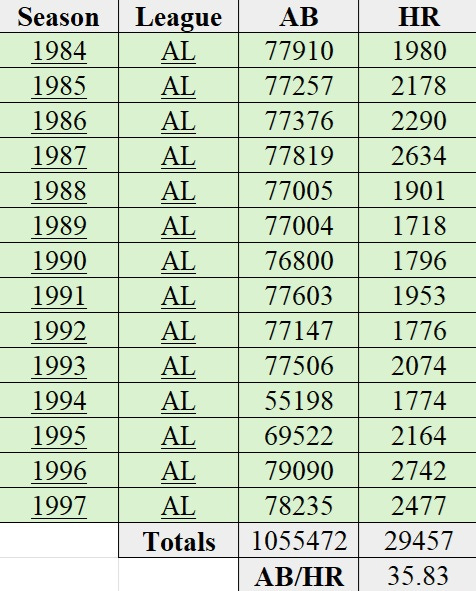
With this data, we can evaluate how Tettleton’s performance compared to the average AL hitter of his era.
Raw Difference: 16.65
Formula: League Average – Player Career AverageImprovement Factor: 1.87x
Formula: League Average / Player Career AveragePercentage Difference: 46.47%
Formula: (League Average – Player Career Average) / League Average × 100%
AB/HR
Tettleton hit a home run approximately every 19.18 at-bats. A lower AB/HR indicates better home run efficiency. The typical AL hitter during Tettleton’s era (1984–1997) hit a home run every 35.83 at-bats.
Raw Difference
Tettleton required 16.65 fewer at-bats per home run than the league average, showing he was significantly more efficient at hitting home runs.
Improvement Factor
Tettleton’s home run rate was 1.87 times better than the league average. In other words, he hit home runs nearly twice as frequently per at-bat as the average AL hitter.
Percentage Difference
Tettleton’s AB/HR was 46.47% lower than the league average, reinforcing his superior power-hitting ability.
Tettleton hit home runs nearly twice as frequently as the average AL player, with a home run every 19.18 at-bats compared to the league’s 35.83. This performance is particularly notable for a catcher, a position where such offensive output is rare. Overall, Tettleton’s stats confirm he was an elite power hitter who significantly outperformed his peers during a transformative era in baseball.
In our initial case study, we analyzed the careers of prominent Japanese and Negro League sluggers, alongside MLB greats Mickey Mantle, Alex Rodriguez, and Joe DiMaggio for comparison.
Now, let's compare Tettleton’s career statistics against these baseball legends to gain a clearer perspective on how he stacks up.
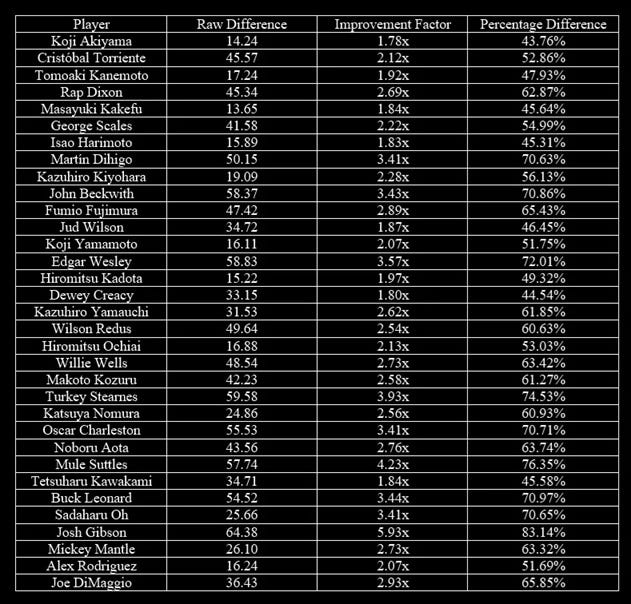
Mickey Tettleton’s statistics closely mirror those of Jud Wilson (34.72/1.87x/46.45%). According to Baseball Reference the Negro League legend’s official statistics reveal a total of 77 home runs over 3,082 at-bats resulting in an average of 40.03 at-bats per home run (AB/HR).
Among the league leaders in home runs during the 1990s, we have analyzed the power-hitting careers of the following players:
Vladimir Guerrero (14.40/1.79x/44.23%)
Vinny Castilla (13.04/1.61x/37.95%)
Tino Martinez (12.08/1.58x/36.54%)
Shawn Green (10.13/1.47x/31.94%)
Sammy Sosa (20.59/2.42x/58.73%)
Ryne Sandberg (13.89/1.47x/31.84%)
Ron Gant (16.41/1.82x/44.95%)
Rob Deer (22.42/2.33x/57.06%)
Rafael Palmeiro (15.95/1.87x/46.43%)
Mo Vaughn (16.09/1.95x/48.82%)
Mike Piazza (17.68/2.09x/52.20%)
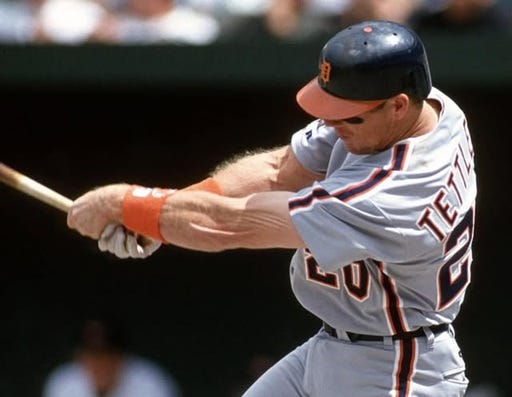
Mickey Tettleton’s performance stands out as particularly remarkable when compared to the impressive lineup of sluggers, especially considering he achieved these feats as a catcher—a position known for its grueling physical demands and historically limited power production at the plate.
With a raw difference of 16.65, Tettleton outshines peers like Vladimir Guerrero (14.40), Vinny Castilla (13.04), Tino Martinez (12.08), Shawn Green (10.13), and Ryne Sandberg (13.89), and holds his own against sluggers like Mo Vaughn (16.09).
His improvement factor of 1.87x ties Rafael Palmeiro’s and surpasses Guerrero (1.79x), Ron Gant (1.82x), Castilla (1.61x), Martinez (1.58x), Green (1.47x), and Sandberg (1.47x).
Tettleton’s percentage difference of 46.47% further cements his edge over Guerrero (44.23%), Gant (44.95%), Castilla (37.95%), Martinez (36.54%), Green (31.94%), and Sandberg (31.84%), and is nearly identical to Palmeiro (46.43%)
If you find this content valuable and would like to support the ongoing studies and articles, your contributions via CashApp are truly appreciated.
Your support helps fund the tools, research, and time dedicated to these projects. Every contribution, no matter the size, plays an important role in keeping this work going.
If you're unable to contribute financially, sharing this article on your social media (X, Facebook, etc.), emailing it to a friend, or texting the link to a fellow baseball fan is just as valuable.
Thank you for your support!