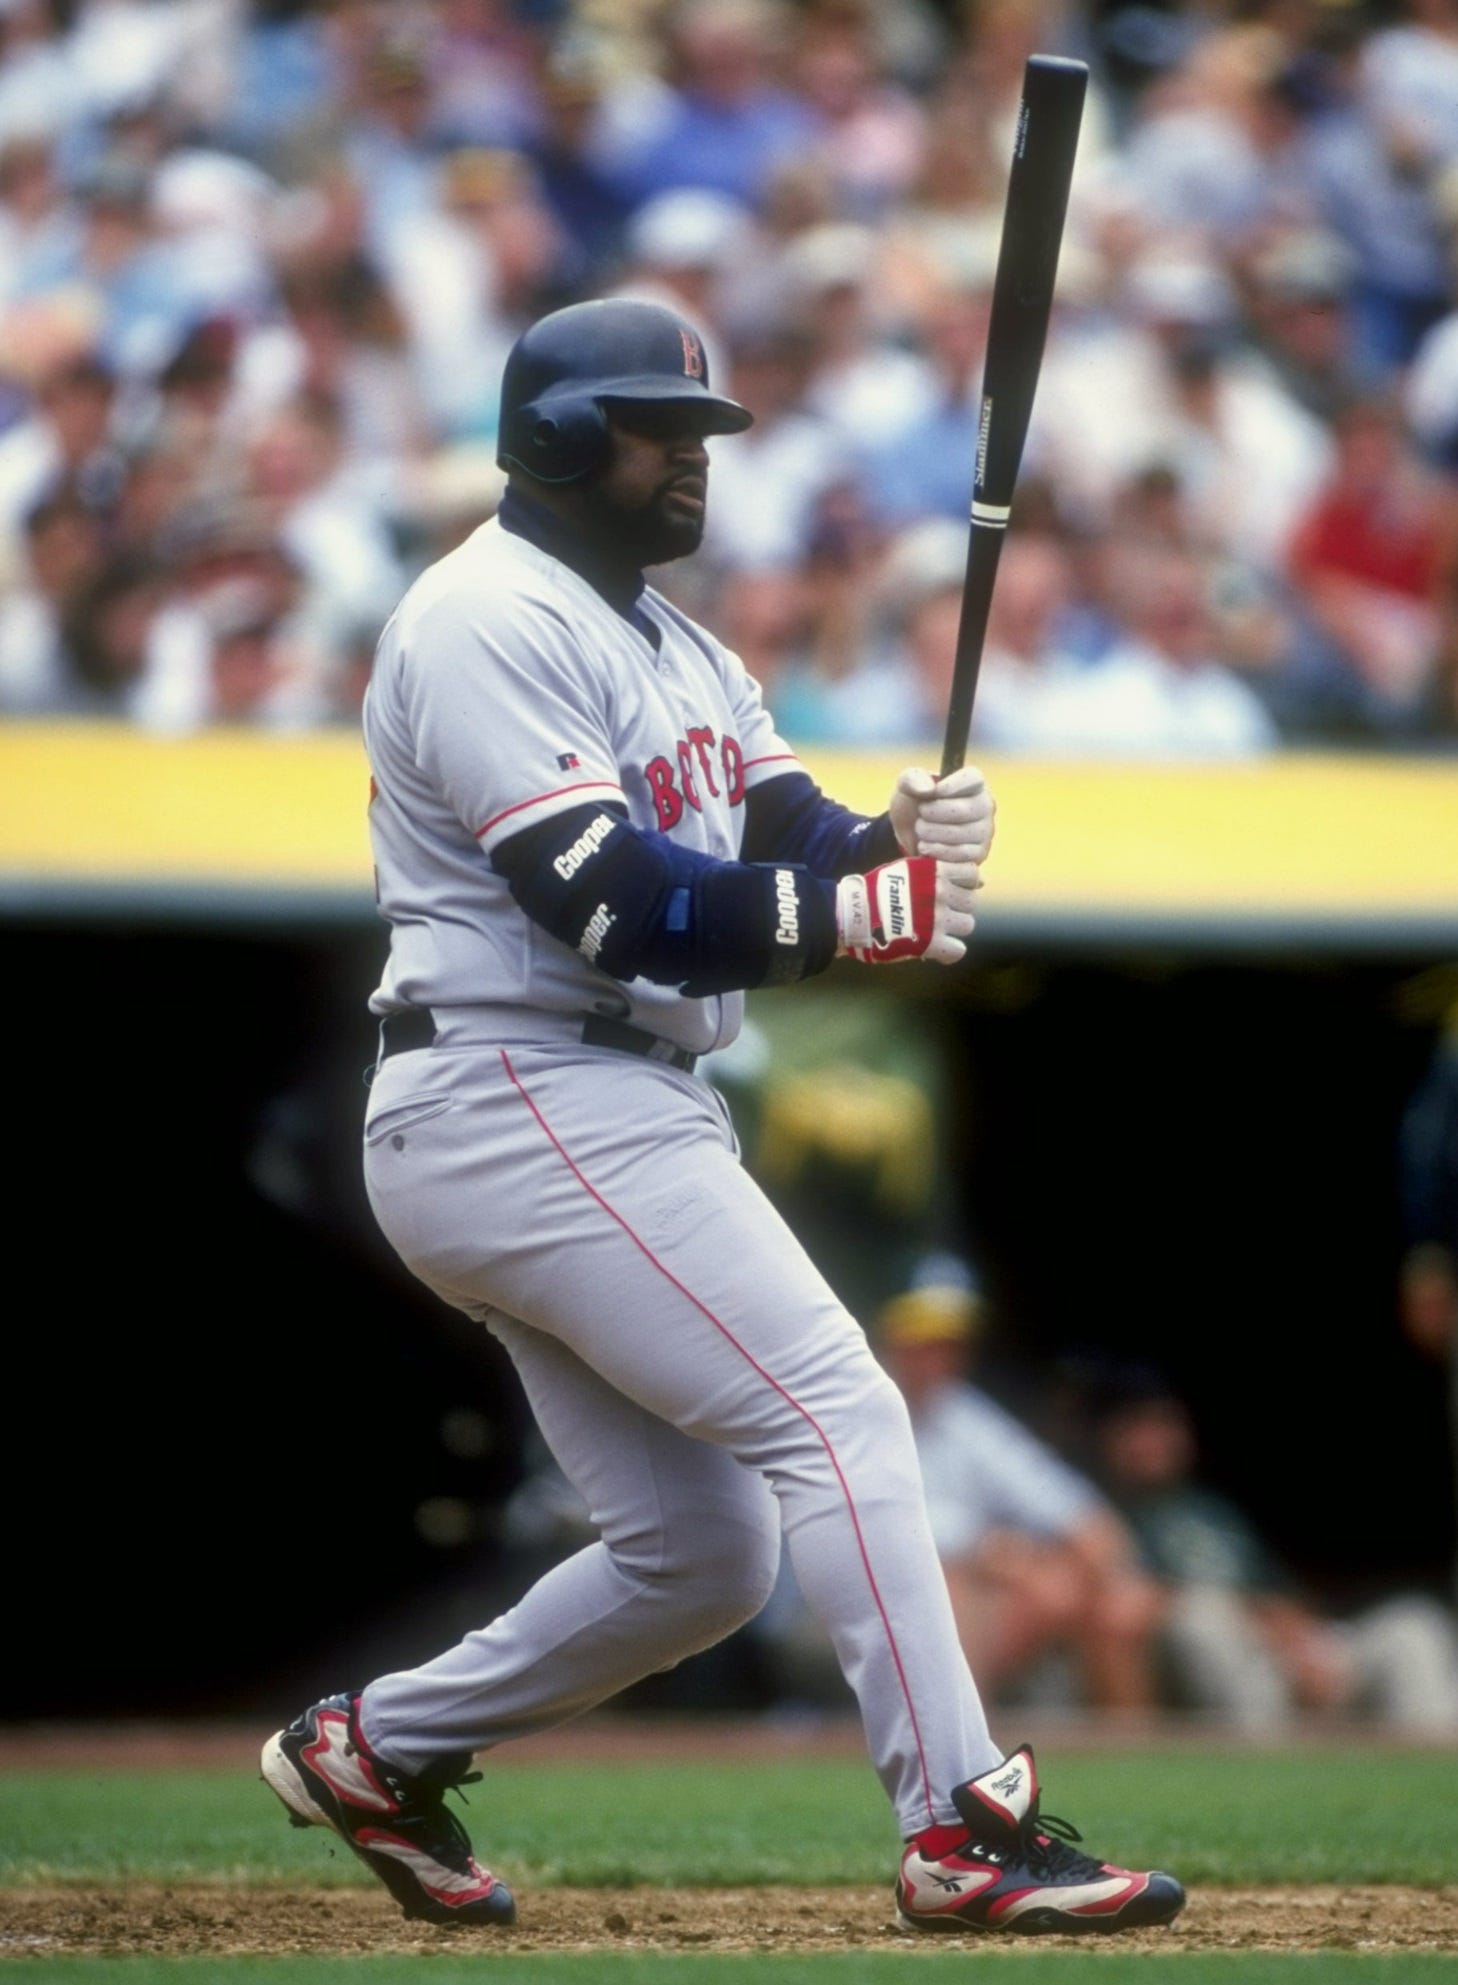
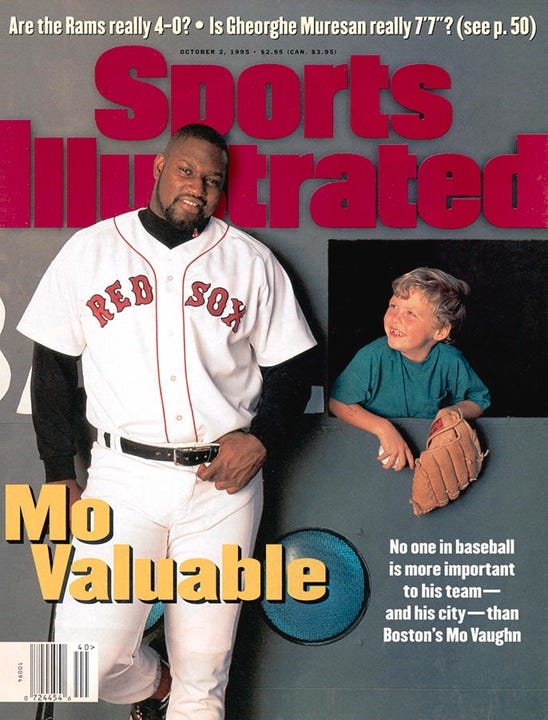
Mo Vaughn: The Hit Dog
The Power Hitter Pantheon: Baseball’s Greatest Home Run Heroes

This project aims to determine the greatest home run hitter of all time by comparing each slugger’s statistics to the average of their era using three formulas. The final adjusted stats will then be used to compare them head-to-head with other all-time greats.
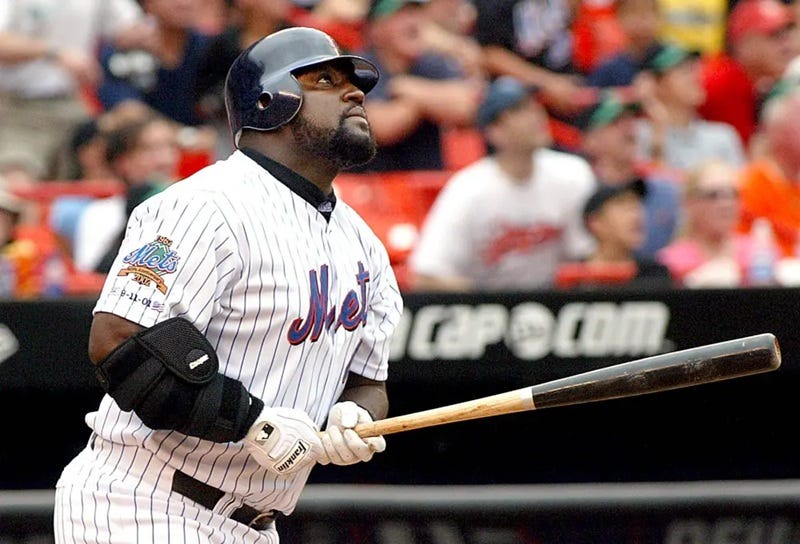
Mo Vaughn will be the next legendary MLB slugger examined in this study. For a detailed biography of Vaughn, please click here.
Before analyzing Vaughn's career numbers, it's essential to recognize his accomplishments as a hitter. Let's examine his rankings in key hitting statistics throughout his career. Vaughn appeared on the MLB leaderboards in the following categories:
1998: #4 (.337)
1996: #10 (.420)
1997: #9 (.420)
1998: #10 (.993)
1996: #6 (207)
1998: #5 (205)
1995: #7 (316)
1996: #5 (370)
1998: #9 (360)
1995: #5 (39)
1996: #7 (44)
1995: #8 (70)
1995: #7 (121)
1996: #3 (158)
1998: #5 (144)
1995: #10 (247)
1996: #2 (316)
1995: #8 (14.10)
1996 was Vaughn’s best season at the plate. In 1996, he appeared in six leaderboard categories, including #2 in times on base (316), #3 in runs created (158), #5 in total bases (370), and #6 in hits (207), alongside 44 home runs (#7) and #10 in on-base percentage (.420). This year showcased a blend of power, consistency, and overall production that outshone his other seasons.
Now that we have a clear understanding of Vaughn's accomplishments, we can proceed with the career analysis. According to Baseball Reference, Vaughn’s official statistics reveal a total of 328 home runs over 5,532 at-bats resulting in an average of at-bats per home run 16.87 (AB/HR).
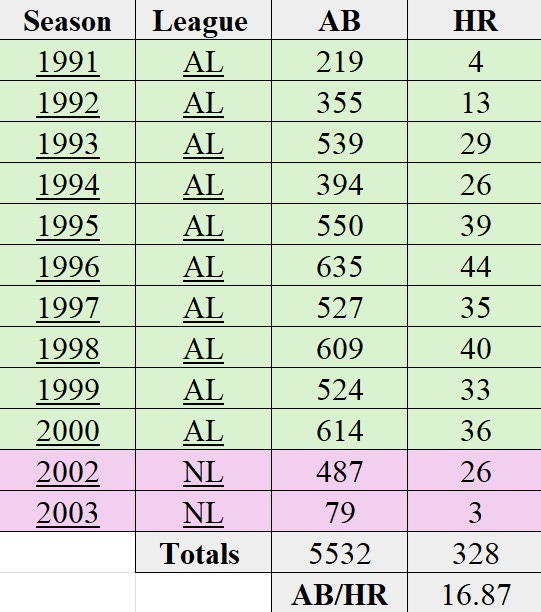
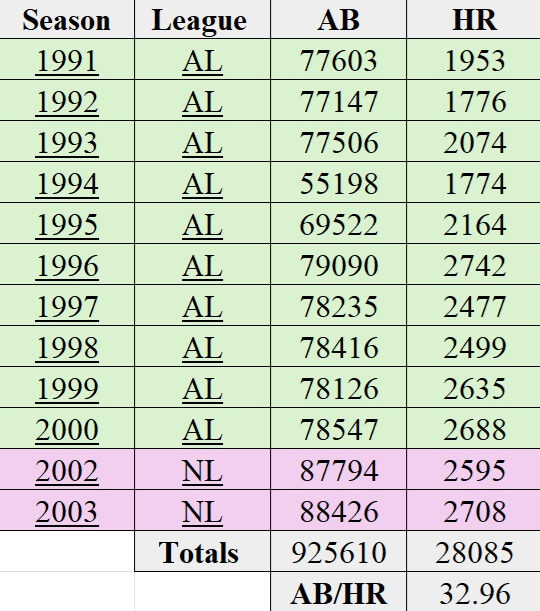
Mo Vaughn played in the American League (AL) from 1991 to 2000 and in the National League (NL) from 2002 to 2003. When aggregating the statistics from each of the seasons Vaughn competed in, the league totals include 925,610 at-bats and 28,085 home runs, resulting in an average of 32.96 at-bats per home run (AB/HR).
With this data, we can evaluate how Vaughn’s performance compared to the average NL/AL hitter of his era.
Raw Difference: 16.09
Formula: League Average – Player Career AverageImprovement Factor: 1.95x
Formula: League Average / Player Career AveragePercentage Difference: 48.82%
Formula: (League Average – Player Career Average) / League Average × 100%
AB/HR
Vaughn hit a home run once every 16.87 at-bats on average. Lower AB/HR values indicate better home run efficiency—fewer at-bats needed per home run. Across the seasons Vaughn played, the average AL/NL hitter required nearly 33 at-bats to hit a home run.
Raw Difference
Vaughn needed 16.09 fewer at-bats per home run than the league average, a substantial gap highlighting his power-hitting prowess.
Improvement Factor
Vaughn was almost twice as efficient at hitting home runs as the average hitter in his era. An improvement factor of 1.95x means his AB/HR rate was vastly better than the league norm.
Percentage Difference
This shows that Vaughn’s AB/HR was 48.82% better (lower) than the league average, reinforcing his elite status as a power hitter.
Mo Vaughn’s career AB/HR of 16.87, compared to the league average of 32.96 during his playing years (1991–2000 AL, 2002–2003 NL), underscores his status as an outstanding power hitter.
These metrics reveal Vaughn hit home runs nearly twice as often as the average player, needing 16.09 fewer at-bats per homer, a 48.82% improvement over the league norm. In short, Vaughn wasn’t just keeping pace with a high-octane era; he was a standout slugger among his peers.
In our initial case study, we analyzed the careers of prominent Japanese and Negro League sluggers, alongside MLB greats Mickey Mantle, Alex Rodriguez, and Joe DiMaggio for comparison.
Now, let's compare Vaughn’s career statistics against these baseball legends to gain a clearer perspective on how he stacks up.
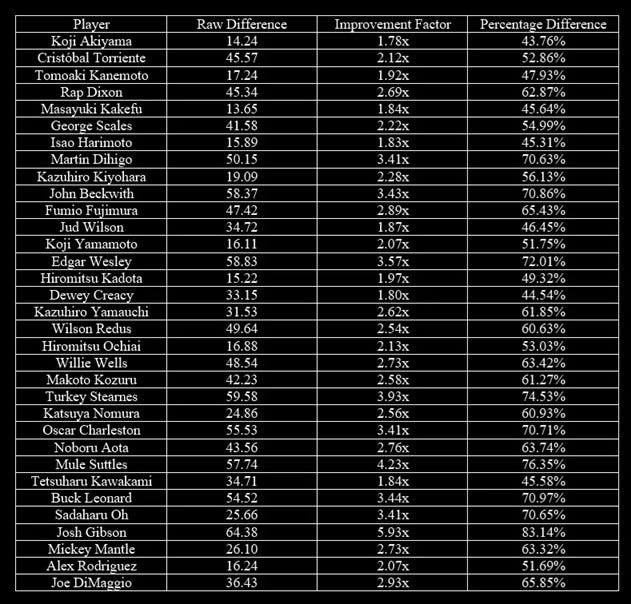
Mo Vaughn’s statistics closely resemble those of Hiromitsu Kadota, a Japanese League icon ranked third all-time in NPB career home runs. Kadota (15.22/1.97x/49.32%) hit 567 home runs across 8,868 at-bats, averaging 15.64 at-bats per home run.
Among the MLB home run leaders of the 1990s, the following players have been analyzed:
Vladimir Guerrero (14.40/1.79x/44.23%)
Vinny Castilla (13.04/1.61x/37.95%)
Tino Martinez (12.08/1.58x/36.54%)
Shawn Green (10.13/1.47x/31.94%)
Sammy Sosa (20.59/2.42x/58.73%)
Ryne Sandberg (13.89/1.47x/31.84%)
Ron Gant (16.41/1.82x/44.95%)
Rob Deer (22.42/2.33x/57.06%)
Rafael Palmeiro (15.95/1.87x/46.43%)
Mo Vaughn’s stats are (16.09/1.95x/48.82%), reflecting how his career average compares to the league average. Across the group of these players, he consistently ranks in the upper tier.
In Raw Difference, his value of 16.09 places him 4th, behind Rob Deer (22.42), Sammy Sosa (20.59), and Ron Gant (16.41), but ahead of Rafael Palmeiro (15.95) and the rest. This indicates a substantial absolute gap between his career average and the league average.
For Improvement Factor, Mo Vaughn’s 1.95x ranks 3rd, trailing only Sammy Sosa (2.42x) and Rob Deer (2.33x), and surpassing Rafael Palmeiro (1.87x) and others. This shows the league average was nearly twice his career average, a significant relative disparity.
Similarly, in Percentage Difference his 48.82% also ranks 3rd, again behind Sosa (58.73%) and Deer (57.06%), but ahead of Palmeiro (46.43%) and the remaining players.
Overall, Mo Vaughn stands out as a strong performer in this context, consistently ranking 3rd or 4th among the listed players. Mo Vaughn edges out notable players like Palmeiro, Guerrero, and Gant in the relative metrics (Improvement Factor and Percentage Difference).
Your support helps fund the tools, research, and time dedicated to these projects. Every contribution, no matter the size, plays an important role in keeping this work going.
If you're unable to contribute financially, sharing this article on your social media (X, Facebook, etc.), emailing it to a friend, or texting the link to a fellow baseball fan is just as valuable.
Thank you for your support!