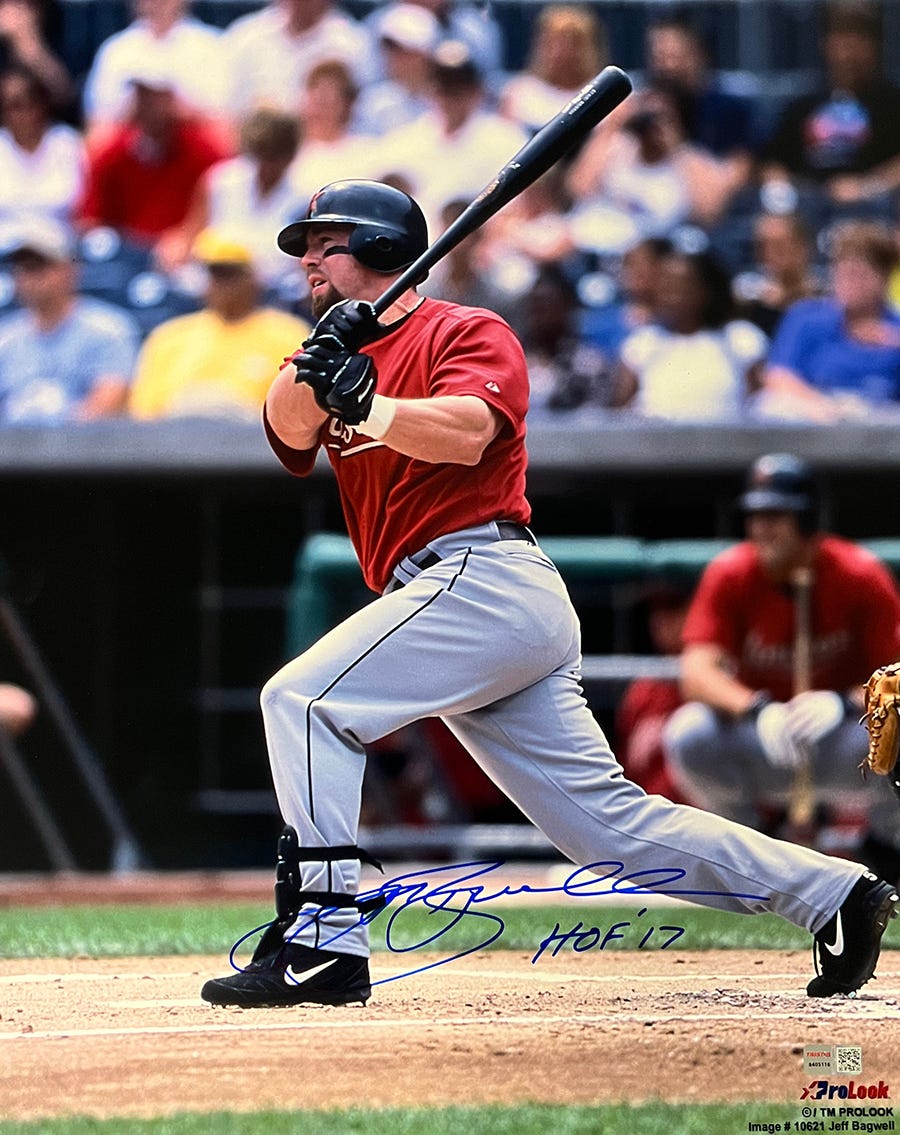
Jeff Bagwell: Baggy
The Power Hitter Pantheon: Baseball’s Greatest Home Run Heroes

This project aims to determine the greatest home run hitter of all time by comparing each slugger’s statistics to the average of their era using three formulas. The final adjusted stats will then be used to compare them head-to-head with other all-time greats.
Jeff Bagwell will be the next legendary MLB slugger examined in this study. For a detailed biography of Bagwell, please click here. Before fully analyzing Bagwell’s AB/HR figures using our formulas and methodology, it’s important to review his key hitting statistics to understand the extent of his offensive impact at the plate:
Total Bases: 4,213
Times On Base: 3,843
Extra Base Hits: 969
Homeruns: 449
On Base + Slugging: .948
Slugging Percentage: .540
On Base Percentage: .408
Batting Average: .297
Now that we’ve reviewed Bagwell’s key hitting statistics, it’s important to highlight his career accomplishments to fully appreciate his overall talent as a baseball player:
Hall of Fame: Class of 2017
1991 NL Rookie of the Year
NL MVP (1994)
NL Gold Glove (1994)
3x Silver Slugger (1994, 1997, & 1999)
3x NL Runs Scored Leader (1994, 1999, & 2000)
100 Runs Scored Seasons: 9 (1994, 1996-2001, 2003, & 2004)
NL OPS Leader (1994)
NL Slugging Percentage Leader (1994)
NL Total Bases Leader (1994)
NL Walks Leader (1999)
NL Doubles Leader (1996)
40-HR Seasons: 3 (1997, 1999 & 2000)
30-HR Seasons: 9 (1994 & 1996-2003)
20-HR Seasons: 12 (1993-2004)
Now that his career accomplishments are clear, let's examine Jeff Bagwell's rankings on MLB leaderboards in key hitting statistics:
1994: #2 (.368)
1994: #4 (.451)
1996: #6 (.451)
1997: #6 (.425)
1998: #7 (.424)
1999: #2 (.454)
1994: #1 (.750)
1997: #7 (.592)
1994: #2 (1.201)
1997: #7 (1.017)
1999: #6 (1.045)
2000: #10 (1.039)
1994: #3 (104)
1998: #5 (124)
1999: #1 (143)
2000: #1 (152)
2001: #7 (126)
1994: #4 (147)
1994: #1 (300)
1997: #8 (335)
2000: #7 (363)
1994: #10 (32)
1996: #3 (48)
1994: #3 (39)
1997: #5 (43)
1999: #9 (42)
2000: #3 (47)
1994: #1 (73)
1996: #8 (81)
1997: #3 (85)
2000: #6 (85)
2001: #9 (86)
1996: #3 (135)
1997: #2 (127)
1998: #5 (109)
1999: #1 (149)
2000: #8 (107)
2001: #7 (106)
2004: #10 (96)
1994: #2 (137)
1996: #6 (156)
1997: #2 (153)
1999: #2 (161)
2000: #6 (156)
1994: #3 (216)
1996: #1 (324)
1997: #4 (305)
1998: #9 (280)
1999: #1 (331)
2000: #5 (305)
2001: #10 (285)
1994: #1 (10.26)
1997: #6 (13.16)
2000: #8 (12.55)
Jeff Bagwell’s best season was 1994, with 13 MLB hitting leaderboard appearances. In the strike-shortened season Bagwell was an insane performer.
#1 Rankings
Slugging (.750)
Total Bases (300)
Extra Base Hits (73)
At Bats per Home Run (10.26)
#2 Rankings
Batting Average (.368)
On Base Plus Slugging (1.201)
Runs Created (137)
#3 Rankings
Runs Scored (104)
Home Runs (39)
Times On Base (216)
#4 Rankings
On Base Percentage (.451)
Hits (147)
#10 Ranking
Doubles (32)
This dominant performance, blending elite power, average, and on-base skills, underscores his Hall of Fame caliber.
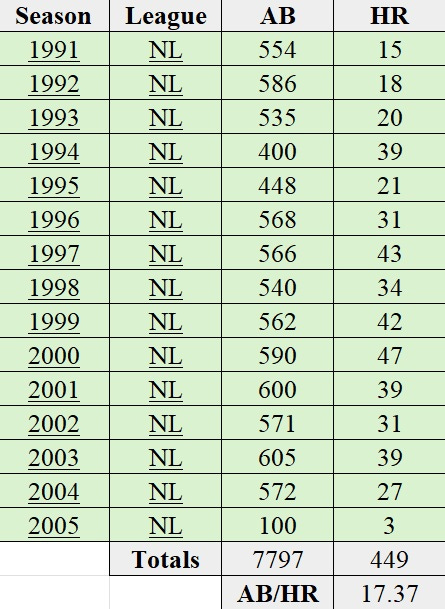
Now that we have a deeper appreciation for Jeff Bagwell as a hitter, we can move forward with our unique career AB/HR analysis. According to Baseball Reference, Bagwell’s official statistics reveal a total of 449 home runs over 7,797 at-bats resulting in an average of at-bats per home run 17.37 (AB/HR).
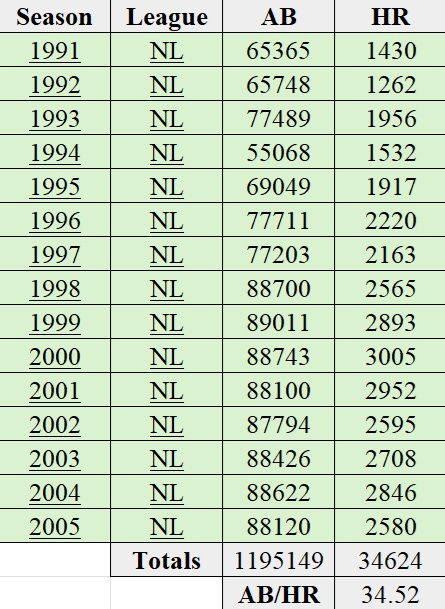
Jeff Bagwell played in the National League (NL) from 1994 to 2005. When aggregating the statistics from each of the seasons Bagwell competed in, the league totals include 1,195,149 at-bats and 34,624 home runs, resulting in an average of 34.52 at-bats per home run (AB/HR).
With this data, we can evaluate how Bagwell’s performance compared to the average NL hitter of his era.
Raw Difference: -17.15
Formula: League Average – Player Career AverageImprovement Factor: 1.99x
Formula: League Average / Player Career AveragePercentage Difference: 49.68%
Formula: (League Average – Player Career Average) / League Average × 100%
AB/HR:
The AB/HR metric measures how frequently a player hits a home run per at-bat, with a lower AB/HR indicating better home run efficiency. Bagwell hit a home run approximately once every 17.37 at-bats. The average NL hitter during this period required about 34.52 at-bats to hit a home run.
Raw Difference
Bagwell required 17.15 fewer at-bats per home run than the average NL hitter. This significant gap highlights his superior power-hitting ability.
Improvement Factor
Bagwell was nearly twice as efficient as the average NL hitter at hitting home runs. His AB/HR was roughly half the league average, indicating exceptional performance.
Percentage Difference
Bagwell’s AB/HR was 49.68% lower than the league average, meaning he was almost 50% more efficient at hitting home runs compared to his peers.
Bagwell’s ability to stand out in this power-heavy era underscores his elite status as a hitter. His 449 home runs over 7,797 at-bats place him among the top power hitters of his time. The 1.99x improvement factor shows Bagwell was nearly twice as effective at hitting home runs as the average NL player. This gap is remarkable in a high-offense era.
In our initial case study, we analyzed the careers of prominent Japanese and Negro League sluggers, alongside MLB greats Mickey Mantle, Alex Rodriguez, and Joe DiMaggio for comparison.
Now, let's compare Bagwell’s career statistics against these baseball legends to gain a clearer perspective on how he stacks up.
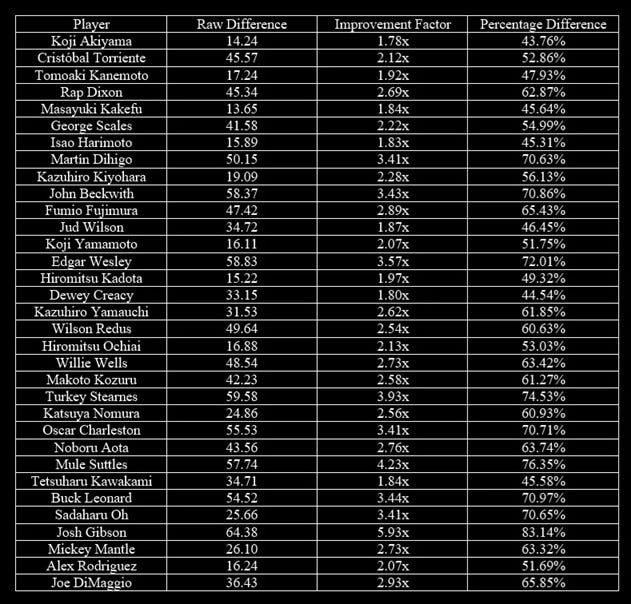
Jeff Bagwell’s statistics closely mirror those of Hiromitsu Kadota (-15.22/1.97x/49.32%). The Japanese League legend hit a total of 567 home runs over 8,868 at-bats resulting in an average of 15.64 at-bats per home run (AB/HR). When aggregating the statistics from each of the seasons Kadota competed in, the league totals include 596,257 at-bats and 19,322 home runs, resulting in an average of 30.86 at-bats per home run (AB/HR).
Among the league leaders in home runs during the 1990s, we have analyzed the power-hitting careers of the following players:
Vladimir Guerrero (-14.40/1.79x/44.23%)
Vinny Castilla (-13.04/1.61x/37.95%)
Tino Martinez (-12.08/1.58x/36.54%)
Shawn Green (-10.13/1.47x/31.94%)
Sammy Sosa (-20.59/2.42x/58.73%)
Ryne Sandberg (-13.89/1.47x/31.84%)
Ron Gant (-16.41/1.82x/44.95%)
Rob Deer (-22.42/2.33x/57.06%)
Rafael Palmeiro (-15.95/1.87x/46.43%)
Mo Vaughn (-16.09/1.95x/48.82%)
Mike Piazza (-17.68/2.09x/52.20%)
Mickey Tettleton (-16.65/1.87x/46.47%)
Matt Williams (-17.62/1.95x/48.75%)
Mark McGwire (-23.70/3.23x/69.08%)
Manny Ramirez (-17.29/2.16x/53.80%)
Larry Walker (-17.35/1.96x/49.04%)
Kevin Mitchell (-21.80/2.23x/55.23%)
Ken Griffey Jr. (-17.84/2.15x/53.41%)
Juan Gonzalez (-18.24/2.21x/54.69%)
Jose Canseco (-18.87/2.24x/55.27%)
Joe Carter (-14.79/1.70x/41.01%)
Jim Thome (-19.16/2.39x/58.20%)
Jeff Bagwell’s metrics place him in the upper half of elite hitters, aligning closely with Hall of Famers like Mike Piazza (52.20%) and Larry Walker (49.04%).
If you find this content valuable and would like to support the ongoing studies and articles, your contributions via CashApp are truly appreciated.
Your support helps fund the tools, research, and time dedicated to these projects. Every contribution, no matter the size, plays an important role in keeping this work going.
If you're unable to contribute financially, sharing this article on your social media (X, Facebook, etc.), emailing it to a friend, or texting the link to a fellow baseball fan is just as valuable.
Thank you for your support!