


The Power Hitter Pantheon: Baseball’s Greatest Home Run Heroes
A Fair Comparison of Baseball’s Most Iconic Home Run Hitters

“What has been will be again, what has been done will be done again; there is nothing new under the sun.” - Ecclesiastes 1:9
If you find this content valuable and would like to support the ongoing studies and articles, your contributions via CashApp are truly appreciated.
Your support helps fund the tools, research, and time dedicated to these projects. Every contribution, no matter the size, plays an important role in keeping this work going.
If you're unable to contribute financially, sharing this article on your social media (X, Facebook, etc.), emailing it to a friend, or texting the link to a fellow baseball fan is just as valuable.
Thank you for your support!

Section 1: Echoes of the Past, Voices of the Present
Baseball has always been home to exceptional hitters, with superstars emerging since the game's inception. It’s crucial to preserve the legacies of past legends while educating newer generations about their impact.
In today’s culture, there’s a tendency to quickly label modern stars as the greatest of all time (GOAT). This trend is seen across multiple sports, fueled by manufactured media pushes that often place current players above past icons.
For instance, LeBron James has been heavily promoted as the greatest basketball player ever, despite not surpassing Kobe Bryant’s legacy, much less Michael Jordan’s. This extends to combat sports as well; before losing his UFC title, Kamaru Usman was touted as the greatest welterweight champion of all time, despite having just 5 title defenses compared to Georges St-Pierre’s 9.
This project aims to celebrate both modern athletes and past legends by offering much-needed perspective.
While many rankings focus on raw numbers or head-to-head stats, they often overlook the key context: how much better a superstar was compared to the average player of their era. Understanding this difference helps facilitate more accurate comparisons across generations.
Section 2: Foundations of the Future
Players from the past shouldn’t be dismissed because of the era they played in, as their contributions were vital to the game’s evolution. Critics often dismiss past legends by claiming they competed against “plumbers and carpenters,” failing to recognize that these athletes faced the best talent available to them, just like today’s players.
Comparing stars to the average athletes of their time serves as an ultimate neutralizer across eras. The heroes of previous generations laid the groundwork, enabling the game to evolve. Would modern hitters be as calculated as they are today without Ted Williams’ influence on approach?
Without past legends, modern players wouldn’t have lucrative contracts that allow them to focus on their careers year-round instead of taking on off-season manual labor jobs. This ongoing study will analyze the top 10 home run hitters each year, focusing on retired players to maintain consistent statistics.
By comparing these players' career performances to the league averages of their time, we can better understand the relative talent of each era and fairly compare past legends to today’s top performers.

Section 3: A Moment of Defiance
Why is the home run the most exciting play in team sports? Why does it stand apart from the excitement of a slam dunk? Why does the thrill of a Hail Mary touchdown pass fall short? What makes a home run so captivating?
In basketball, when Steph Curry has the ball, he and his team are on offense. The same goes for Patrick Mahomes in football. The defense reacts to Curry’s every move when he has the ball, the same can be said for Mahomes. But in baseball, the hitter is actually on defense.
The hitter is not in possession of the baseball—the pitcher is. The batter is tasked with reacting to the pitcher’s actions, facing overwhelming odds: not just the pitcher, but the entire defense—three outfielders, four infielders, and the catcher.
The pitcher controls the game, and the batter’s success depends entirely on what’s thrown. Deion Sanders, who played both in the NFL and MLB, has said baseball was the toughest sport to master. It’s why hitting .300 is considered exceptional—you’re essentially playing defense while being expected to produce offensive output!
Why is the home run so thrilling? Because it defies the odds. The hitter is significantly outnumbered yet with one swing, he neutralizes nine opposing players. The homerun is the ultimate underdog moment—it’s baseball’s knockout blow.
Section 4: Numbers in the Wind
As sports fans, we thrive on debate, particularly when it comes to identifying the greatest players and the factors that contribute to their greatness. For baseball fans, the conversation inevitably returns to the timeless question: who is the greatest home run hitter of all time?
Some may argue in favor of Babe Ruth, others may point to Barry Bonds, while some might advocate for Josh Gibson, Albert Pujols, or Hank Aaron. International legends like Sadaharu Oh may even enter the discussion. Who is right, and who is wrong? This debate is endless, and that is the true beauty of sports.
The purpose of this project is to identify the top home run hitters in baseball history and establish a clear methodology for comparing past and present players. While no approach is perfect, my opinions are rooted in data, logic, and common sense.
Many consider “career totals” to be the definitive measure of a player's greatness, but this approach often overlooks the aspect of efficiency. For instance, Hank Aaron hit 755 home runs, while Babe Ruth hit 714. At first glance, Aaron appears to be the superior hitter.
However, Aaron accumulated 12,364 at-bats, whereas Ruth had only 8,399. It stands to reason that Aaron would hit more home runs, given that he had nearly 4,000 more at-bats than Ruth. This significant discrepancy in at-bats distorts the comparison, highlighting why raw career totals alone are an unreliable metric.
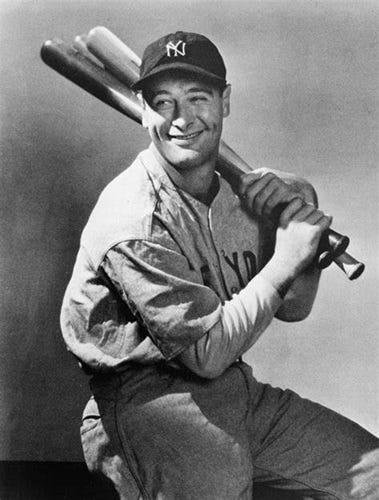
Another common method of comparison is “AB/HR”, which measures a player's efficiency by calculating at-bats per home run. While this is an improvement over career totals, it still has its limitations. For example, Barry Bonds had a career AB/HR of 12.92, while Lou Gehrig’s was 16.23. Based on these numbers, one might conclude that Bonds was the superior home run hitter.
However, this analysis overlooks a crucial factor: the context of the eras in which they played. In 1934, Gehrig hit 49 home runs; and in 2000, Bonds also hit 49. While it may seem logical to assume their power was identical due to the equal number of home runs, is this truly the case?
In 1934, the Boston Red Sox hit just 51 home runs as a team and the Pittsburgh Pirates hit 52 home runs as a team. In contrast, in 2000; the Boston Red Sox hit 167 home runs as a team, and the Pittsburgh Pirates hit 168 home runs as a team.
Gehrig hit nearly as many home runs as an entire team! The significant disparity in team home runs between the two years underscores the greater significance of Gehrig's accomplishment. Therefore, directly comparing the career statistics of Lou Gehrig and Barry Bonds doesn’t quite make sense.
So, how do we fairly compare power across generations?
Section 5: Three Paths to Power
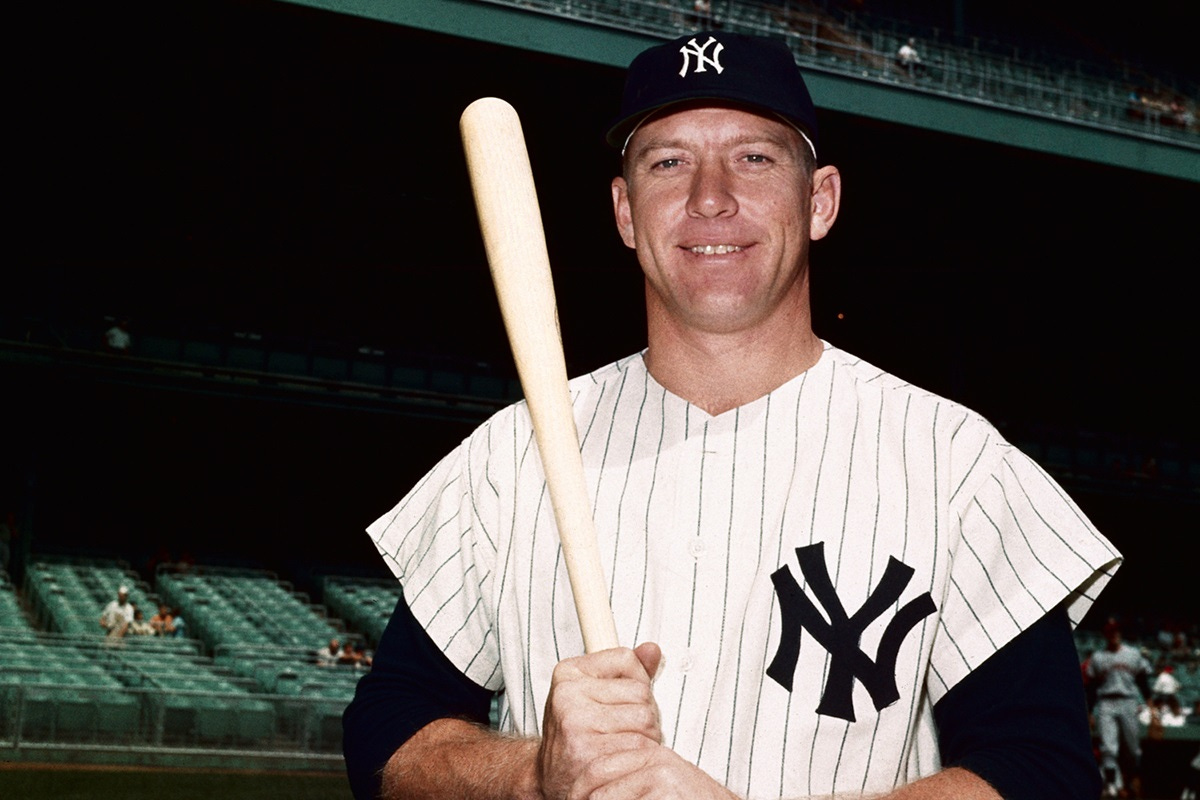
To accurately assess a power hitter's performance, it's crucial to compare their output to the league average over the course of their career. Let's use Mickey Mantle as an example. Mantle played in the American League from 1951 to 1968. During this period, the AL totaled 856,908 at-bats and 20,791 home runs. Using the AB/HR formula, the league average was 41.22.
Mantle hit 536 career home runs across 8,102 at-bats, resulting in an AB/HR of 15.12. His career AB/HR was significantly better than the league average of his era, but by how much?
To evaluate his relative performance, we'll use a three-pronged approach:
1. “Raw Difference”
Formula: League Average – Player Career Average
Calculation: 41.22 – 15.12 = 26.10
Result: Mantle’s AB/HR was 26.10 at-bats per home run lower than the league average.
Explanation: This measures the absolute difference in at-bats needed to hit a home run. A lower AB/HR is better for a power hitter, so subtracting Mantle’s number from the league average shows his edge in raw terms.
Benefits:
Simplicity: It’s straightforward and easy to compute—just subtraction.
Intuitive: Gives a clear sense of the gap in performance (26 fewer at-bats per home run is a big deal!).
Use Case: Great for quick comparisons or when you want a tangible number to grasp the difference without ratios or percentages.
2. “Improvement Factor”
Formula: League Average / Player Career Average
Calculation: 41.22 / 15.12 = 2.73
Result: Mantle’s home run rate was 2.73 times better than the league average.
Explanation: This is a ratio that shows how many times more efficient Mantle was at hitting home runs compared to the league. A value greater than 1 means he outperformed the average; 2.73 means he was nearly three times as effective.
Benefits:
Relative Strength: Highlights the magnitude of outperformance in a multiplicative way (e.g., "almost 3x better" is impactful).
Scalable: Works well for comparing players across eras or leagues with different averages, as it’s a unitless ratio.
Use Case: Ideal for emphasizing dominance or when you want a single number to capture relative efficiency.
3. “Percentage Difference”
Formula: (League Average – Player Career Average) / League Average × 100%
Calculation: (41.22 – 15.12) / 41.22 × 100% —> 26.10 / 41.22 × 100% = 63.32%
Result: Mantle’s AB/HR was 63.32% better than the league average.
Explanation: This expresses the raw difference as a percentage of the league average, showing how much better Mantle was relative to the baseline. Since a lower AB/HR is better, the positive percentage reflects his improvement over the norm.
Benefits:
Normalized Comparison: Puts the difference in context of the league average, making it easier to compare across different scales or eras.
Familiarity: Percentages are widely understood, so it’s accessible for casual fans or analysts.
Use Case: Perfect for stats communication (e.g., “Mantle was over 63% better than average”) or when comparing multiple players to a common benchmark.
How the Formulas Differ
Raw Difference (26.10): Focuses on the absolute gap in at-bats per home run. It’s a direct subtraction, so it’s in the same units (at-bats) as the original AB/HR metric.
Improvement Factor (2.73): A ratio that compares the two rates multiplicatively. It’s unitless and emphasizes how many times better Mantle was, rather than the exact difference.
Percentage Difference (63.32%): Also relative, but expressed as a proportion of the league average. It’s a percentage, so it normalizes the raw difference to the league baseline.
Formula Recap:
Raw Difference: Best for a quick, concrete sense of the gap. It’s raw and unadjusted, so it’s great for straightforward storytelling (e.g., “Mantle saved 26 at-bats per homer!”).
Improvement Factor: Shines when you want to highlight dominance or efficiency in a bold way (e.g., “He was 2.73 times better!”). It’s also versatile for cross-era comparisons.
Percentage Difference: Offers a balanced, normalized view that’s easy to interpret and compare (e.g., “63% better than average” is relatable and precise).
Now that we've discussed the formulas and their respective measurements, how would a head-to-head matchup between sluggers from different eras unfold?
Section 6: A Tale of Two Sluggers
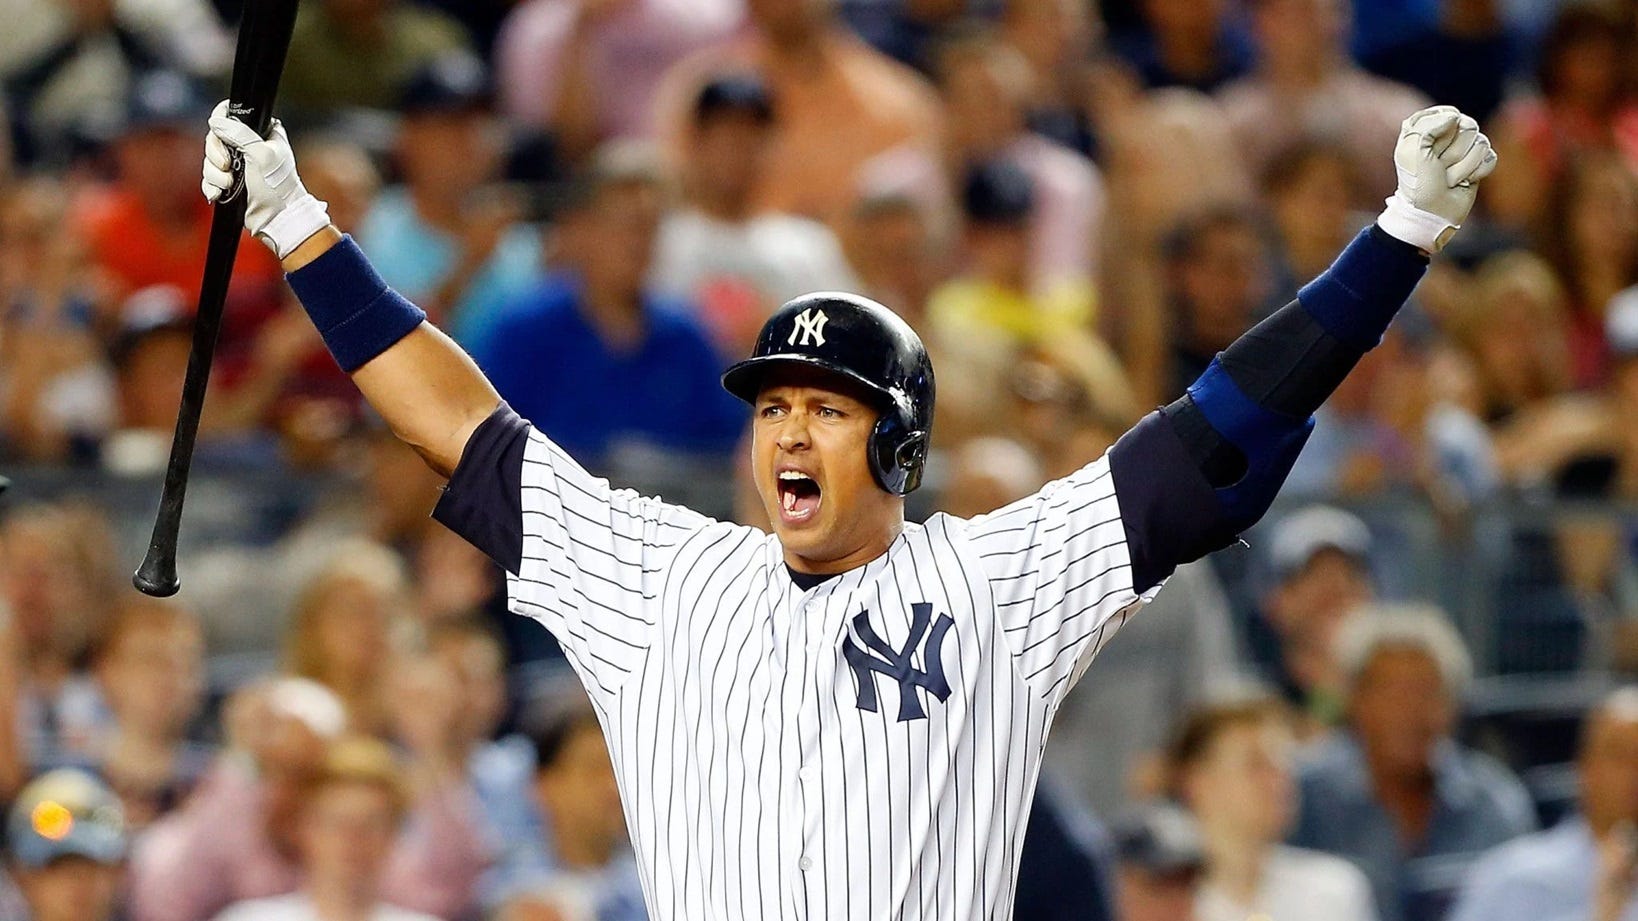
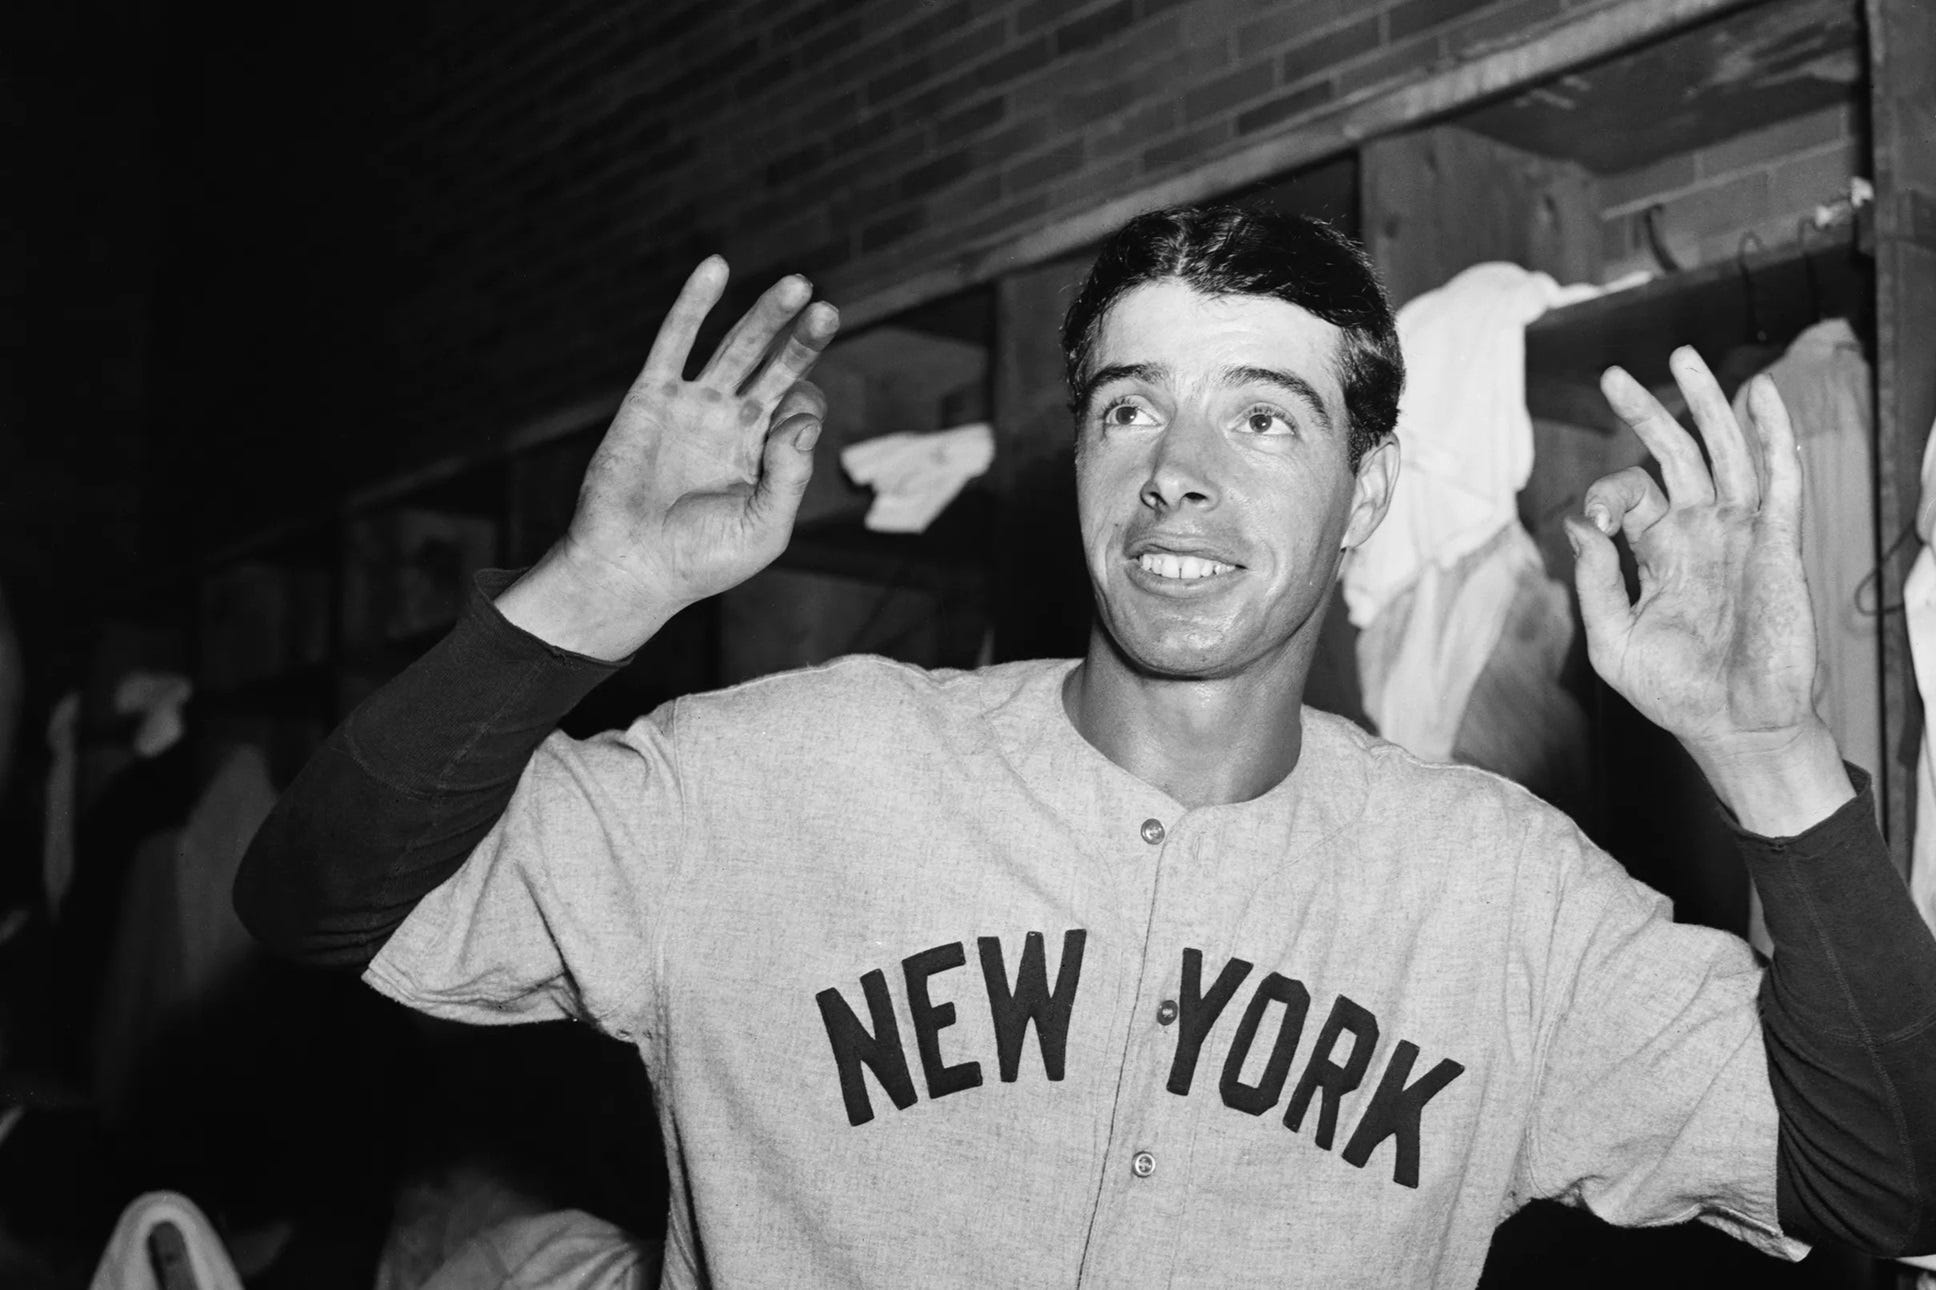
Let’s analyze all three approaches in action by comparing Yankee legends Alex Rodriguez and Joe DiMaggio.
Alex Rodriguez hit 696 home runs over 10,566 at-bats, with an AB/HR ratio of 15.18.
Joe DiMaggio hit 361 home runs over 6,821 at-bats, with an AB/HR ratio of 18.89.
During Rodriguez’s career (1994-2013, 2015-2016), the American League had 1,702,820 at-bats and 54,189 home runs, yielding an average AB/HR ratio of 31.42.
During DiMaggio’s career (1936-1942, 1946-1951), the American League had 553,074 at-bats and 9,997 home runs, resulting in an average AB/HR ratio of 55.32.
While A-Rod hit more home runs and posted a superior AB/HR ratio, does this make him the better home run hitter?
1. Raw Difference
DiMaggio: 36.43 (55.32 – 18.89)
A-Rod: 16.24 (31.42 – 15.18)
Insight: DiMaggio’s AB/HR was 36.43 at-bats better than his era’s average, while A-Rod’s was only 16.24 better. This suggests DiMaggio stood out more starkly against his peers. However, the league averages differ significantly (55.32 vs. 31.42), reflecting different offensive environments. DiMaggio’s era had fewer home runs per at-bat, so his raw gap is naturally larger.
2. Improvement Factor
DiMaggio: 2.93 (55.32 / 18.89)
A-Rod: 2.07 (31.42 / 15.18)
Insight: DiMaggio was 2.93 times better than his league’s average—nearly tripling the norm—while A-Rod was 2.07 times better, roughly doubling it. This ratio highlights DiMaggio’s relative dominance more clearly, as it adjusts for the baseline frequency of home runs in each era.
3. Percentage Difference
DiMaggio: 65.85%
A-Rod: 51.69%
Insight: DiMaggio’s AB/HR was 65.85% better than his league average, compared to A-Rod’s 51.69%. This normalized metric reinforces that DiMaggio’s performance was a bigger leap over his contemporaries, even though A-Rod’s raw AB/HR was better.
Key Findings
A-Rod’s Strengths: More total home runs (696 vs. 361) and a better raw AB/HR (15.18 vs. 18.89), reflecting longevity and a higher home run environment in the 1990s–2010s.
DiMaggio’s Strengths: Greater relative impact. Across all three metrics, he outshines A-Rod compared to their respective league averages (36.43 vs. 16.24, 2.93 vs. 2.07, & 65.85% vs. 51.69%).
Why the difference?
Era Context: DiMaggio played in an era with a higher league AB/HR (55.32), meaning home runs were rarer. His ability to hit 361 HR in 6,821 AB was exceptional for the 1930s–50s. A-Rod’s era (31.42 AB/HR) saw more frequent home runs, partly due to factors like ballpark dimensions, stronger players, and (controversially) PED use in the 1990s–2000s.
Career Length: A-Rod had 10,566 AB over 22 seasons, while DiMaggio had 6,821 AB over 13 seasons (with three years lost to WWII). A-Rod’s higher totals reflect more opportunities, but DiMaggio’s efficiency shines in a shorter span.
Despite A-Rod’s superior raw statistics, DiMaggio was the more impactful home run hitter relative to his era. The advantage of using league averages is that they help neutralize era differences.
This three-pronged approach offers a fair way to evaluate all-time great hitters:
Raw Difference: Captures the tangible gap in performance. It’s a great starting point but can be skewed by era differences (e.g., DiMaggio’s higher league AB/HR inflates his number).
Improvement Factor: Emphasizes relative efficiency with a multiplicative metric. It’s excellent for highlighting dominance (e.g., DiMaggio’s near-3x factor).
Percentage Difference: Balances the two by normalizing the gap to the league average, offering a fair, percentage-based comparison across eras.
This methodology will be used to evaluate all-time great hitters. The formulas and steps outlined provide a deeper analysis of the true caliber of home run hitters throughout history. By incorporating all three approaches, we account for both absolute performance and era adjustments.
Is this a history series of Baseball legends?
Oh I wish I had this idea.
Congrats on being an innovator. You’ve got a subscriber.
I am an immortal reader!